When you analyse Austin on our VantageRE platform, the headline number looks unambiguously good.
Net yield, what the market actually pays you after local tax and the cost of money, has climbed to 9%, up 1.3 percentage points on the year. If you stopped reading the dashboard there, you would conclude that Austin is simply getting better for the rental investor, and you would buy.
The number underneath it tells you to slow down.
The number everyone looks at
Here is the yield, first, because it is the one that sells the story.
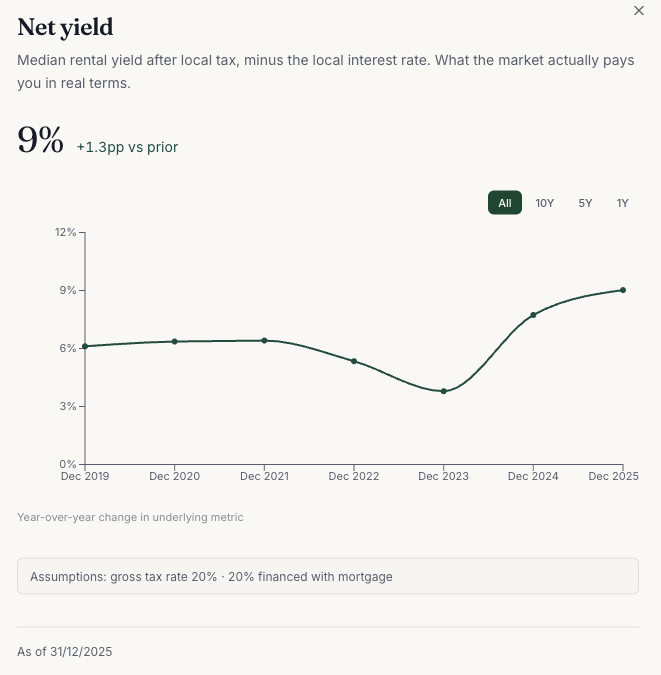
Notice the shape rather than the endpoint.
Yield held flat around 6% through 2019 to 2021, then fell through 2022 and into 2023 (that dip is the interest-rate spike doing its work, because net yield subtracts the cost of money, and money got expensive fast).
From the 2023 trough it has climbed steeply to today's 9%, as rates eased off and rents kept rising.
So the 9% is partly a recovery and partly a genuine gain. The question any serious investor should ask is not "is 9% good", it is "what was driving the rent growth underneath it, and is that driver still there."
For that, you look at supply.
The number that explains it
Austin's rents did not rise in a vacuum. They rose because, for most of the last fifteen years, the city added people faster than it added homes.
That gap, annual population growth minus annual housing handovers, is the housing shortfall, and a positive shortfall is the pressure that pushes rents and prices up.
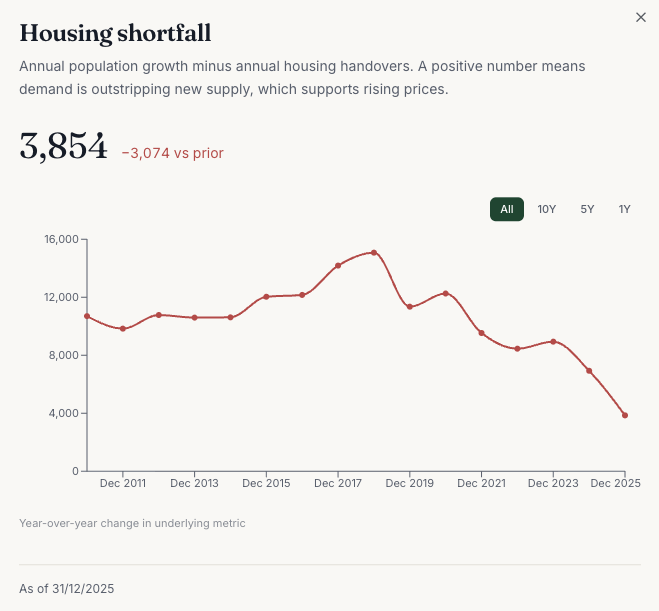
The shortfall peaked around 2018 at roughly 15,000 and has been falling since. The decline has accelerated recently: last year it dropped by more than 3,000, landing at 3,854, the lowest point in the last 15 years. Austin spent the 2010s as a place where demand badly outran supply. It is fast becoming a place where the two are nearly in balance.
That is the engine behind the rent growth, and the engine is winding down.
Reading the two together
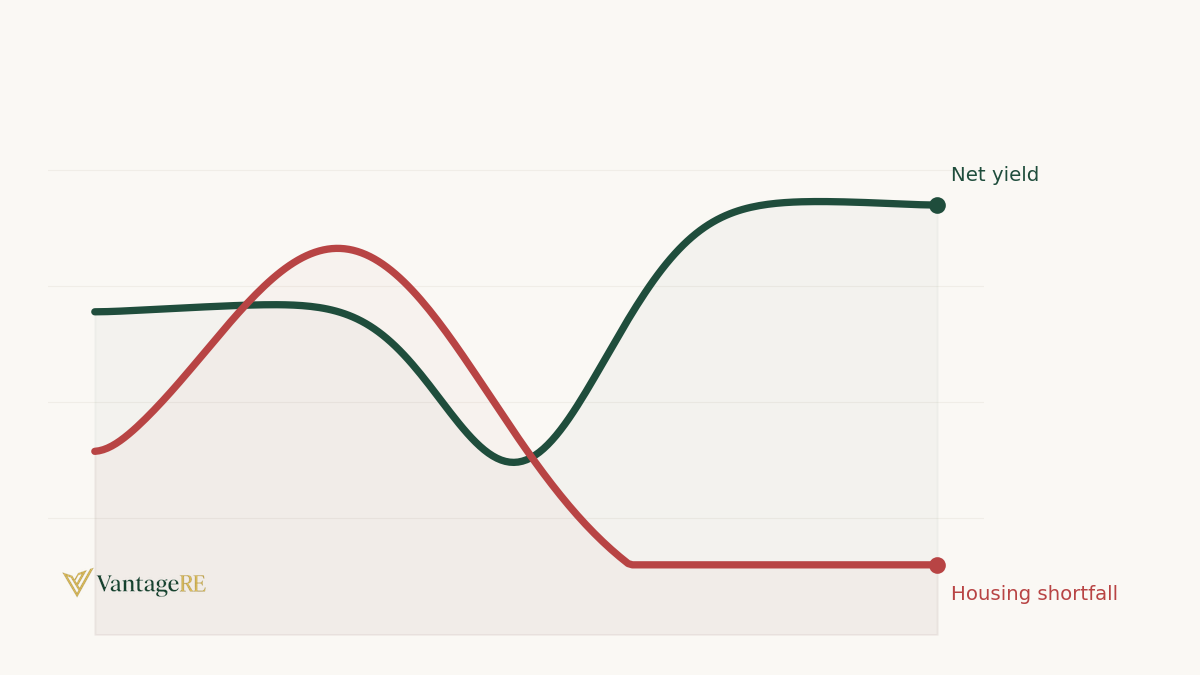
This is where having both numbers on the same platform earns its keep. Looked at alone, the yield chart says "going up, buy." Looked at alone, the shortfall chart says "supply is catching up." Put side by side, they say something more precise: the recent surge in net yield has been riding a supply-demand imbalance that is rapidly disappearing.
A shortfall of 3,854 is still positive, and demand still edges out supply, so this is not a forecast of falling rents. It is a forecast of slowing rent growth. The tailwind that took yield from its 2023 trough to 9% was extraordinary, and extraordinary tailwinds do not persist once the imbalance feeding them closes.
If handovers keep pace with population growth, and the trend says they are catching up quickly, the rent growth component of that yield has far less room to run than the last two years would suggest.
INSIGHT: A rising yield built on a shrinking supply gap is a number that is not meant to persist. When the shortfall balances out, the yield will stagnate, with a lag.
Why this is the kind of thing top-down data is for
None of this is visible from a listing. A property page in Austin will show you the rent, the price, and a yield that looks excellent right now. It will not show you that the structural force behind that yield has been weakening for years, because no individual building has a view of the city's supply pipeline.
This is exactly the gap top-down research is meant to fill. The granular, bottom-up data tells you what a property earns today. The macro data tells you whether the conditions that produced today's number are still in place tomorrow. You need the first to choose between two apartments. You need the second to decide whether to be in the market at all, and Austin is a clean example of the two pointing in subtly different directions.
The takeaway
Austin is not a market to avoid. A 9% net yield with demand still ahead of supply is a healthy place to own property. But the investor who buys today expecting the last two years to repeat is extrapolating from a tailwind that the data says is fading. The realistic case is more sober: solid current yield, slowing growth ahead, as supply finishes catching up to demand.
The VantageRE research team writes on cross-border property, tax, and residency. Independent, no sponsored coverage, no sales scripts.
Join the VantageRE private beta — country pages, comparison tools, and live datasets.